
7 Search Analytics Questions Every eCommerce Team Should Ask Before Acting on the Answers
 Parinay RikhyNovember 10, 20266 min read

As Product Analytics Lead at HawkSearch, Parinay Rikhy works with eCommerce teams to understand search performance and uses those learnings to help shape HawkSearch Analytics. In this installment of the Analytics Insights series, he shares seven questions from that work and what teams should check before acting on the answers.
A search performance review often starts with a simple question: how much revenue is associated with search? Answering it well means looking closely at how shoppers used search, landing pages, and recommendations before they placed an order.
In my first Insights post, I wrote about how the Analytics Assistant helps teams explore follow-up questions. This post covers seven questions worth bringing to any search performance review, and what to check before acting on the answers.
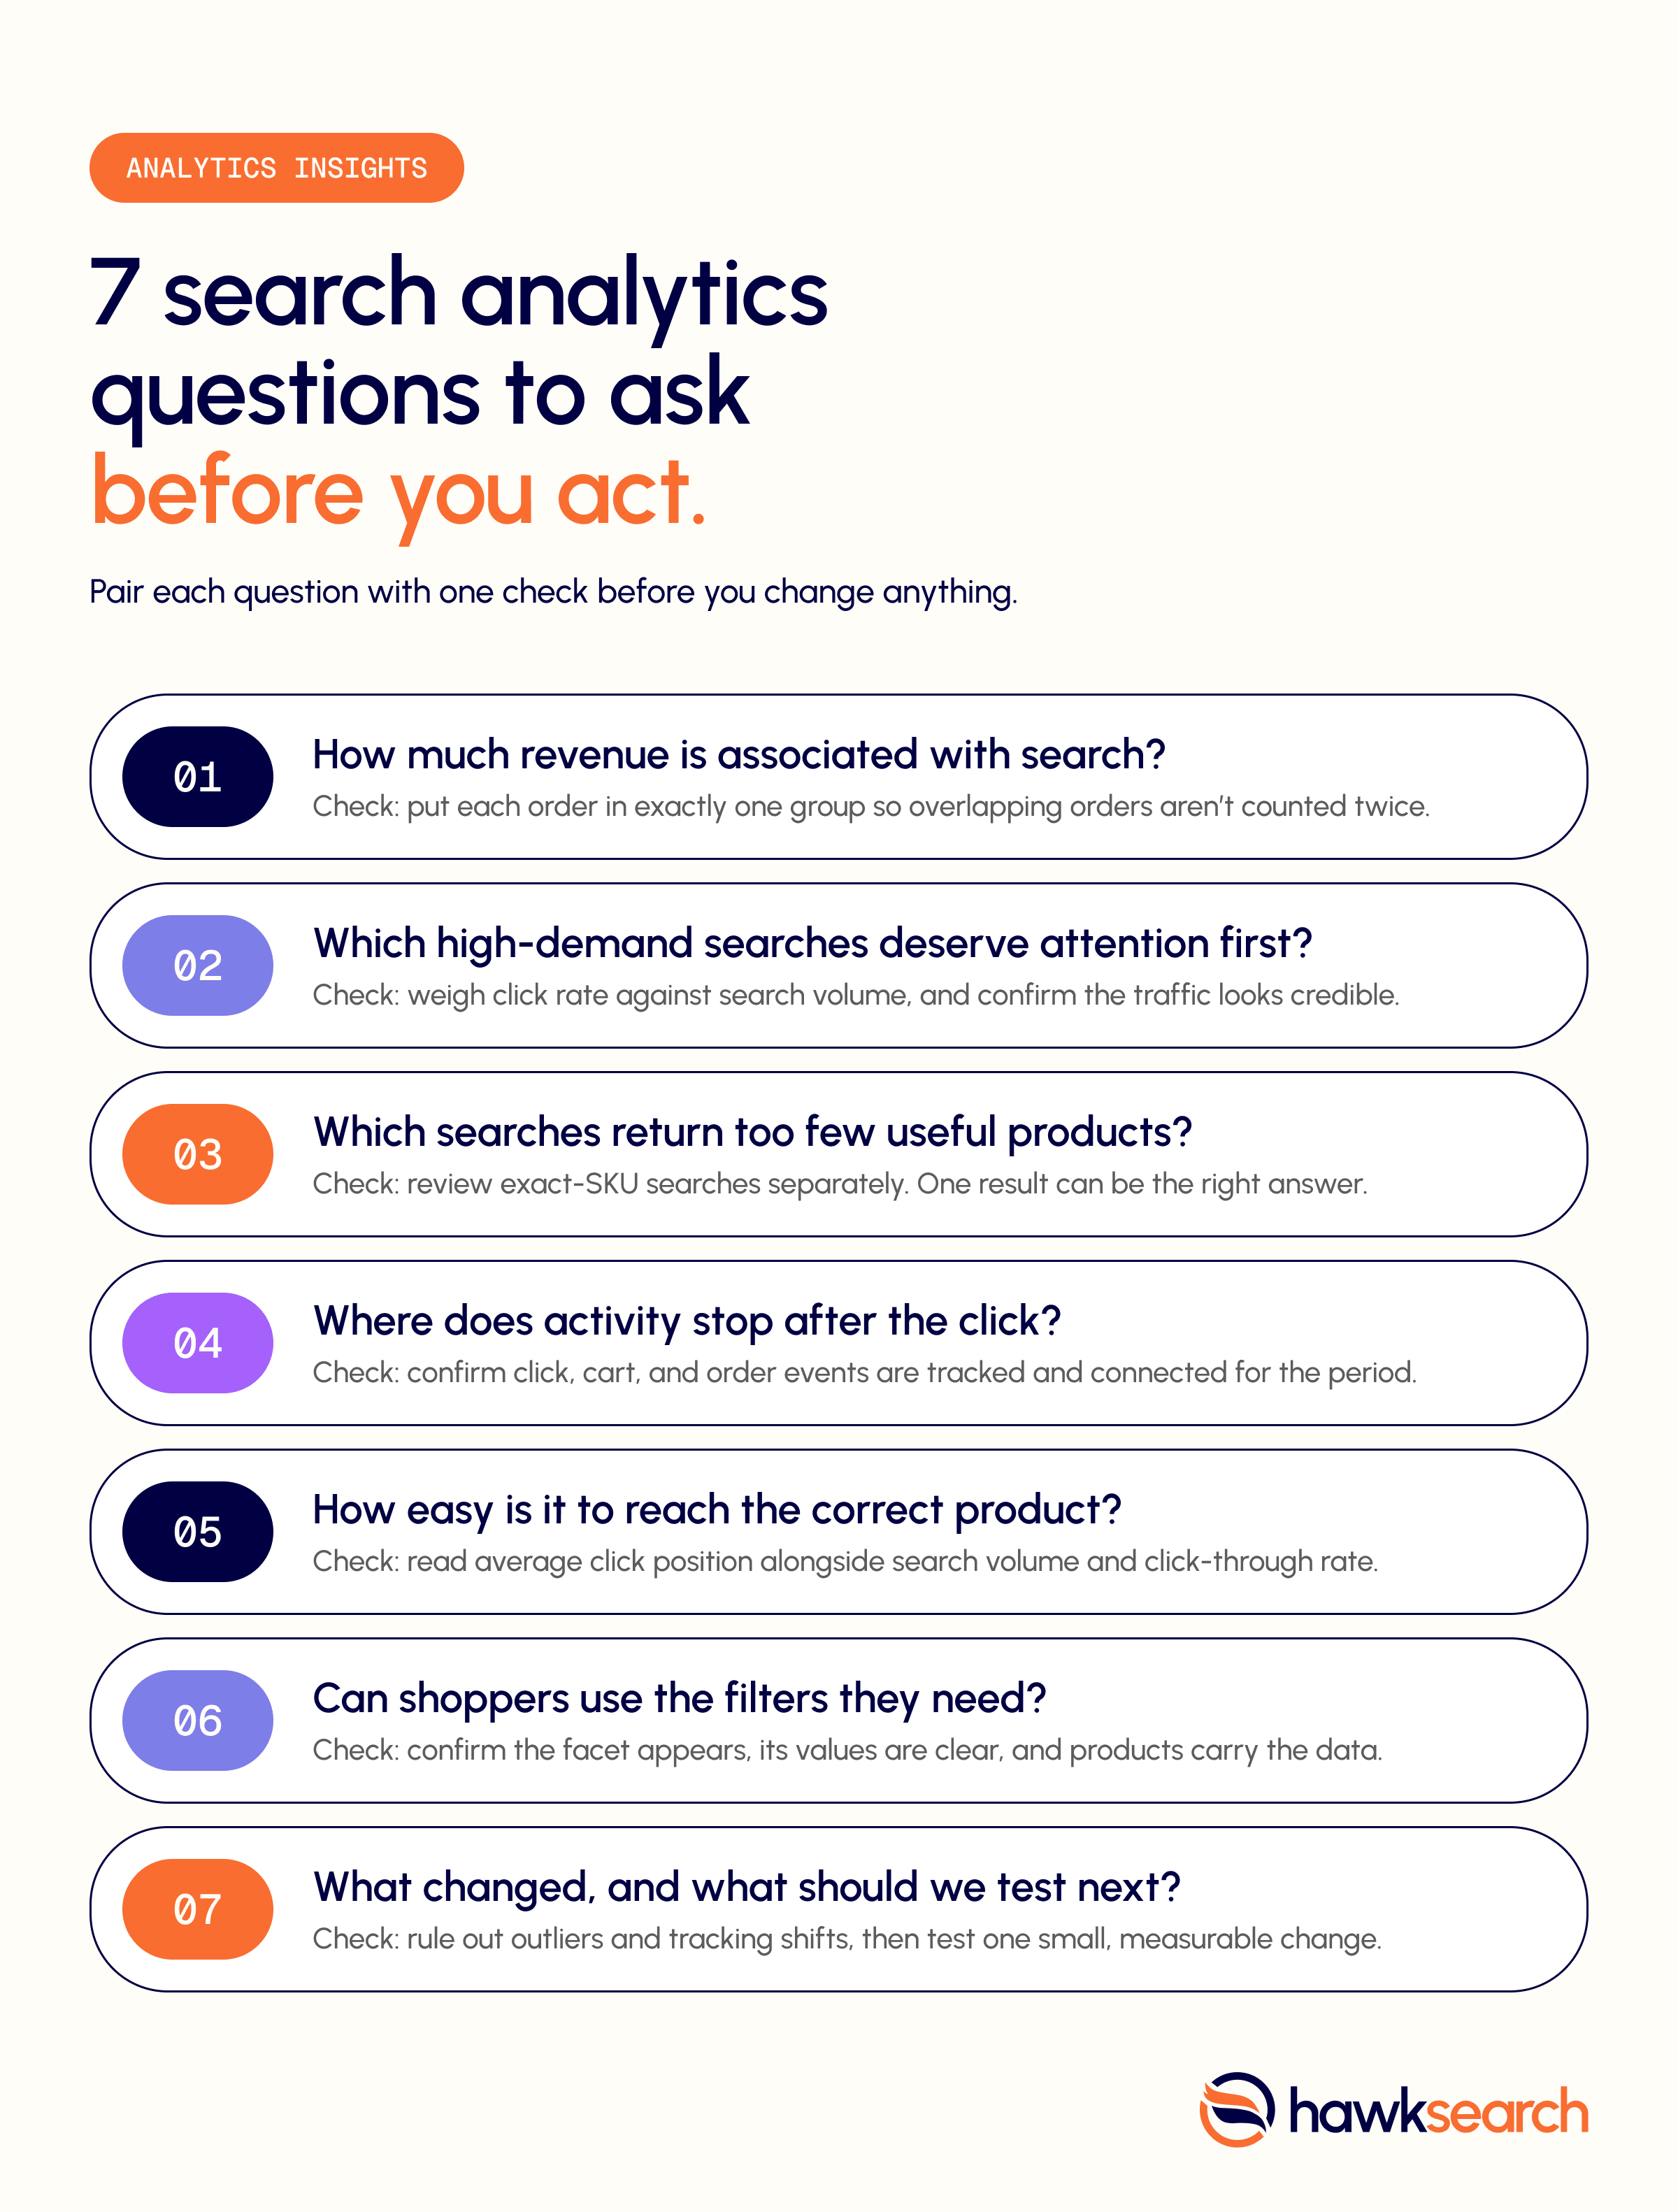
1. How much revenue is associated with search?
Breaking down search revenue has been a big part of my recent customer work. The recurring challenge is explaining how the different pieces relate to the total.
A shopper might type a keyword, visit a landing page, filter results, and make a purchase. One order can be tied to several of those interactions, so adding up the separately reported revenue pieces can count the same order more than once.
In a recent customer analysis, we separated orders into three groups: search only, landing pages only, and both search and landing pages. Each order belonged to exactly one group. This made the overlap clear and produced a breakdown that reconciled to the overall total.
The "both" group matters. It captures orders associated with search and a landing page and counts each of them only once. Recommendations need the same overlap check.
Before totaling search-associated orders, agree on the time frame, engines, experiences, and what counts as an order. If more than one engine is involved, keep each engine visible and confirm how orders are defined before combining anything.
Tracked order value shows revenue associated with an experience. It does not show how much additional revenue search generated. Proving incremental growth requires a comparison that can support that claim.
2. Which high-demand searches deserve attention first?
A low click rate can look urgent until you see the search ran only a handful of times. A search performed thousands of times with a low click rate deserves far more attention.
We recommend looking at volume and engagement first, then at what shoppers were trying to find. For search click-through rate, use the share of searches where at least one product was clicked. Total clicks tells a different story, because one search can produce several clicks.
Before treating volume as demand, check whether the activity looks credible. Unusual search activity can justify investigating automated traffic, but it doesn't prove the traffic is automated.
Start with what shoppers searched for, then check whether those searches led to a product click. This narrows a large set of keywords to the one’s worth investigating further.
3. Which searches return too few useful products?
In a B2B customer analysis covering June 17 through August 29, 2026, about 26% of keyword searches returned a single product. Those searches had a 33.3% product click rate, the highest of any result-count group we reviewed.
Findings like that have made me more cautious about treating a small result set as a problem. A shopper searching for an exact part may expect only one result. A shopper searching by category may want several options to compare and filter.
The Queries with Poor Results report is built to flag low result counts for review. A flagged search doesn't mean the products returned are irrelevant, or that shoppers were dissatisfied with them.
Review exact-SKU searches separately from broader keyword searches, then assess results and engagement within each group. Is the search returning what the shopper needs? In practice, a higher result count only helps if it improves the shopping experience.
4. Where does activity stop after the click?
When searches get clicks but few tracked orders, start by understanding what happens after the product click. Availability, pricing, product information, and the checkout process can all affect the next step. Missing tracking can also leave the picture incomplete.
Before drawing conclusions, check two things. Are click, cart, and order events available for the period? Does the implementation connect them to the experience being analyzed?
From there, compare the products drawing the most clicks with the products reaching the cart and order stages. Keep keyword attribution separate from unique order value. Several keywords can be attributed to the same order, so summing keyword attribution rows can overstate order value.
5. How easy is it to reach the correct product?
During live search testing ahead of the Customer Summit, an exact-SKU search placed the intended product fourth among 21 results. Searching the full product title placed it first among 19.
Both searches returned the product. The difference was how easily a shopper could reach it.
That's why click position is useful alongside live testing. For an exact-SKU search, find out why the correct product ranks below others. For a broad category search, shoppers may be comparing products, so a lower click position can mean something different.
Average click position includes only recorded clicks. Review it alongside search volume and click-through rate, so a good average doesn't hide searches where nobody clicked.
The next step is a focused ranking test, with a check that searches already performing well stay that way.
6. Can shoppers use the filters they need?
Live testing revealed missing category and collection filters, along with inconsistent catalog values. If a filter isn't available, low usage says little about shopper interest. Different spellings or formats for the same value also make the catalog harder to narrow.
Before removing a facet for low usage, check three things: whether it appears on relevant searches, whether its values are easy to understand, and whether products have the data to populate it.
Then look at what happens after shoppers apply it. Low sitewide usage doesn't mean a filter goes unused in a specific category. Compare usage in the parts of the catalog where the filter should help shoppers most.
7. What changed, and what should we test next?
In one customer's monthly analysis, a single large order accounted for about 83% of tracked order value. That one purchase heavily skewed the monthly total, and it needed a different explanation than a broad increase in buying activity.
Before calling a change growth or decline, look beneath the surface:
- Were the periods comparable?
- Did order counts move with revenue?
- Were the same engines and request types included?
- Did tracking change?
When you do make a change, keep it small enough to measure. In search tuning, that might mean setting exact-SKU priority on one engine, documenting the current state, and then evaluating searches on that engine. This shows the effect, and any regressions, before you go further.
An alert brings a change to your attention. The investigation should establish what happened and whether the evidence supports acting on it.
Putting the questions to work
These questions shape how I build HawkSearch Analytics. My goal is for every customer to leave a search review knowing what deserves attention, what still needs validation, and which change to test next.
Parinay Rikhy
Related Blog Posts

Ready to Make Every Search Count?
See what AI-powered product discovery can do for your eCommerce experience and your revenue.